Heikin-Ashi candles become more and more popular these days among traders. When you use HA candles your chart becomes more smooth and it’s easier to spot trends and reversals on it. In this article, I’ll show you how easy it is to compute Heikin Ashi candles in Python.
First, let’s start with exporting libraries I need in my script:
import pandas as pd
import datetime as dt
from apis.binance.klines import download_kline_data
import plotly.graph_objects as go
I’m exporting 4 libraries:
- pandas – for data frame functionality
- datetime – working with times
- apis.binance.klines – to get data from Binance
- plotly – for nice candle plots
Next, let’s get the data:
# Ticker and timeframe
TICKER = "BTCUSDT"
INTERVAL = "1d"

# Backtest start/end date
START = dt.datetime(2017,8,17)
END   = dt.datetime.now()

pd_data = download_kline_data(START, END, TICKER, INTERVAL)
I’m getting data for 1d timeframe for BTCUSDT from the Binance exchange. I’ll use this data next to compute HA candles. We can check if data we downloaded is valid:
pd_data
Data seems to be ok:

Next, let’s compute HA candles. I create a function heikinashi. You can pass to it a data frame with Open/High/Low/Close and it will compute Heikin-Ashi candles and will output a data frame with the resulting data:
def heikinashi(df: pd.DataFrame) -> pd.DataFrame:

    df_HA = df.copy()
    df_HA['Close']=(df_HA['Open']+ df_HA['High']+ df_HA['Low']+df_HA['Close'])/4

    for i in range(0, len(df)):
        if i == 0:
            df_HA['Open'][i]= ( (df_HA['Open'][i] + df_HA['Close'][i] )/ 2)
        else:
            df_HA['Open'][i] = ( (df_HA['Open'][i-1] + df_HA['Close'][i-1] )/ 2)

    df_HA['High']=df_HA[['Open','Close','High']].max(axis=1)
    df_HA['Low']=df_HA[['Open','Close','Low']].min(axis=1)
    return df_HA
For the HA candles I used following formulas:
- HA_Close = (Open + High + Low + Close ) / 4
- HA_Open = (HA_Open[1] + HA_Close[1]) / 2
- HA_High = max(HA_Open, HA_Close, High)
- HA_Low = min(HA_Open, HA_Close, Low)
As you can see formulas are very simple. Now Let’s call this function and check the result of it:
df_HA = heikinashi(pd_data)
df_HA

It seems to work, now we can try to plot it to see how HA Candles looks on the chart:
fig = go.Figure(data=[go.Candlestick(x=df_HA.index, open=df_HA.Open, high=df_HA.High, low=df_HA.Low, close=df_HA.Close)] )

fig.update_layout(title = "BTC HA Candles", xaxis_title = 'Date', yaxis_title = 'Price')

fig.show()
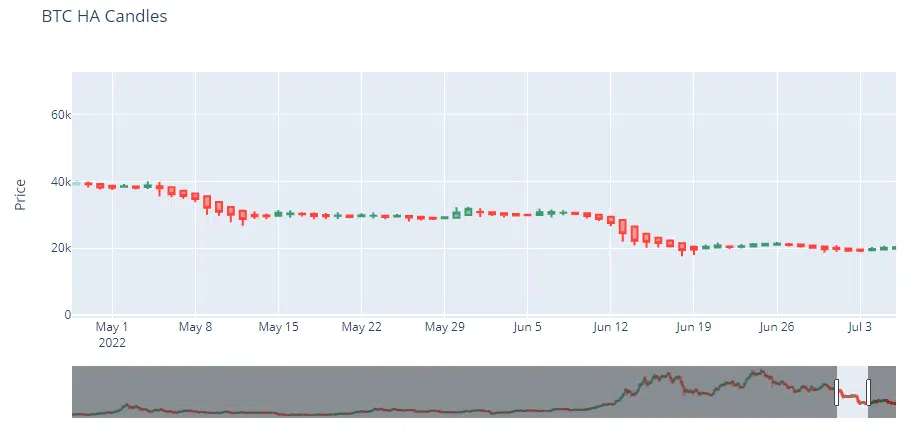
It looks good. Now you can start to look at HA candles to analyze trades better. Also, you can try to compute some indicators and signals on top of HA candles as well. This can also might look pretty interesting as well.
Follow me on TradingView and YouTube.