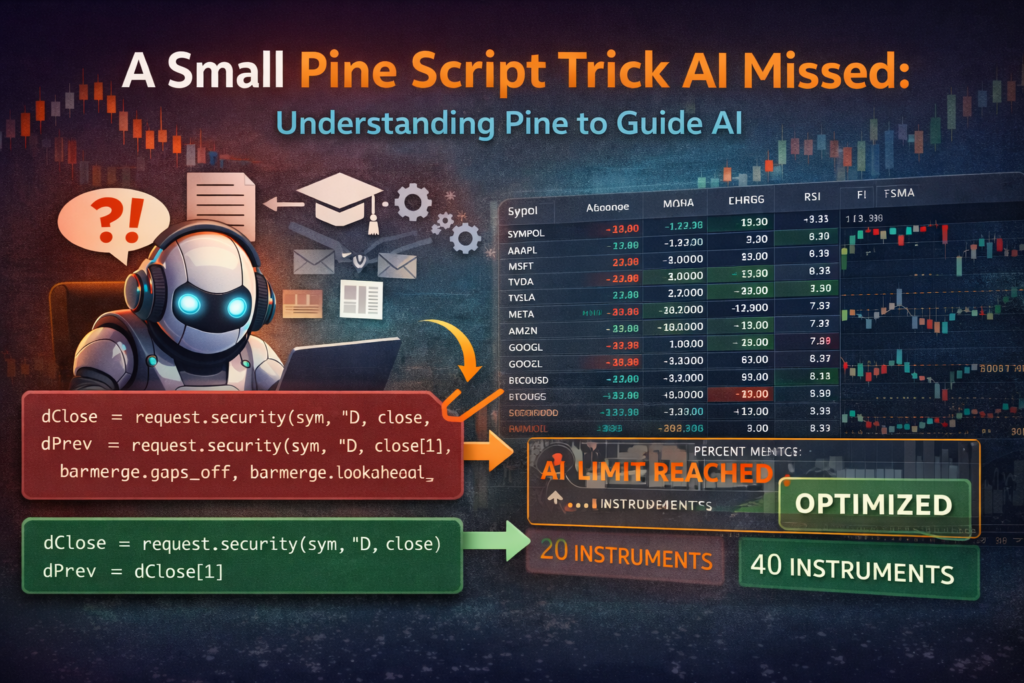
Recently I built a small dashboard for my TradingView charts. Markets have been moving fast lately, and I found myself constantly switching between different screeners and watchlists just to monitor the instruments I care about. So instead of jumping between tabs, I decided to build something simple: A Pine Script table that displays multiple instruments A Pine Script Optimization AI Missed (And Why It Matters) Read More →
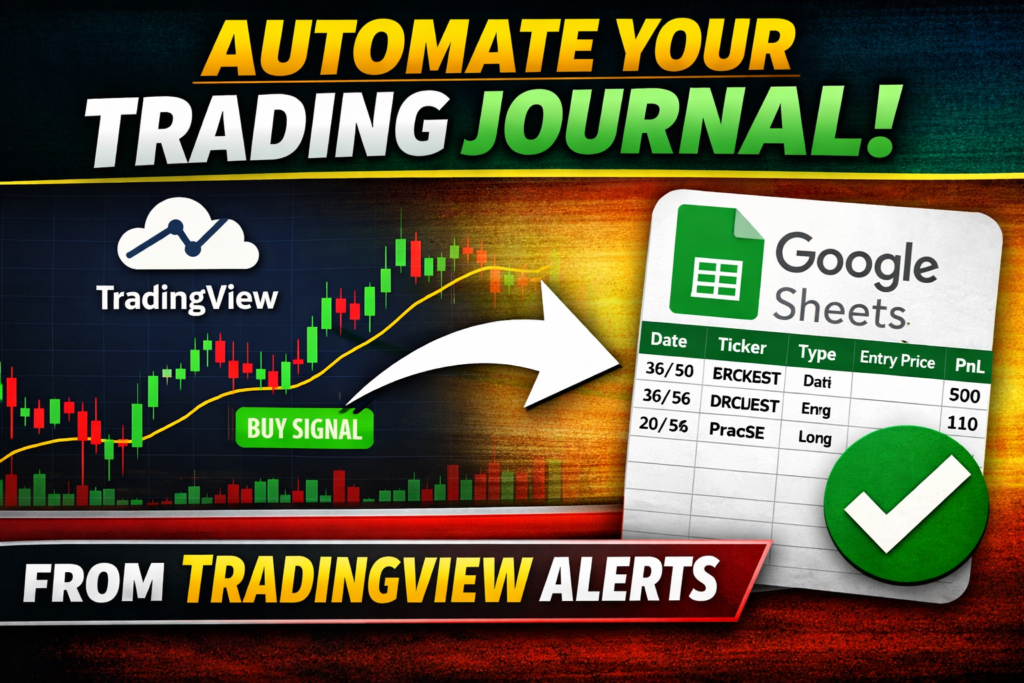
Tracking trades is essential for improving any trading strategy. But manually logging every trade is time-consuming and error-prone. In this guide, you’ll learn how to automatically log trades from TradingView alerts into Google Sheets using Google Apps Script. This system uses TradingView webhook alerts to send JSON data directly into a Google Sheet that acts How to Build an Automatic Trading Journal From TradingView Alerts (Free, No Zapier) Read More →
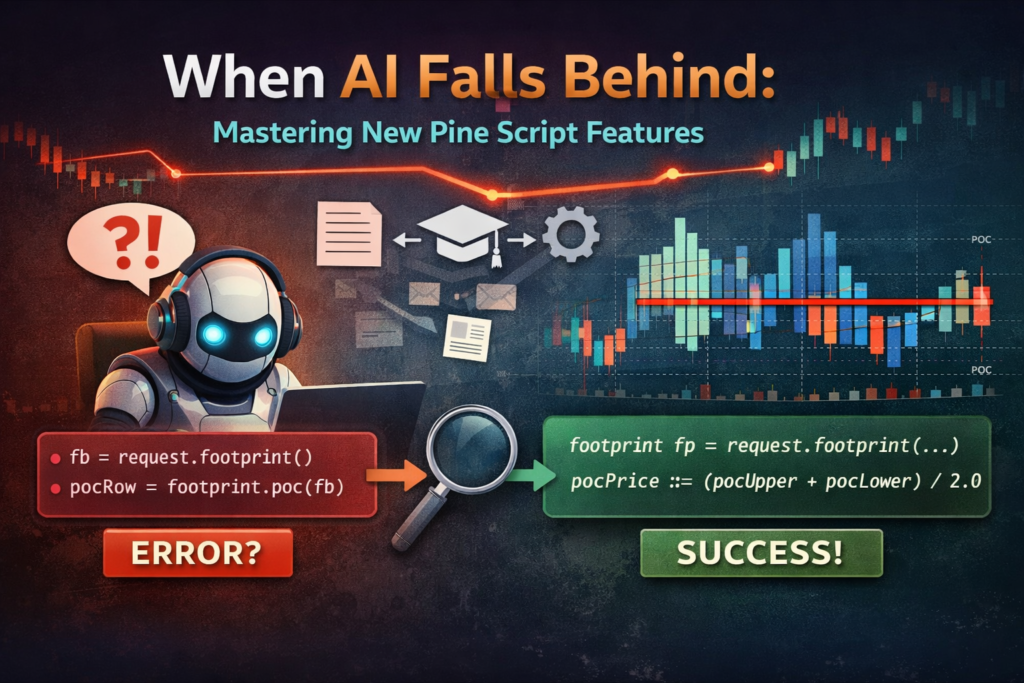
Recently, TradingView released something many Pine Script developers had been waiting for: TradingView Introduces Native Volume Footprints in Pine Script https://www.tradingview.com/blog/en/volume-footprints-in-pine-scripts-56908 With Pine Script v6, we finally got access to request.footprint() — allowing us to programmatically access footprint data inside scripts. This is a big deal. And it also exposed something very important: When new When AI Is Behind: What the New Pine Script Footprint Feature Teaches Us Read More →
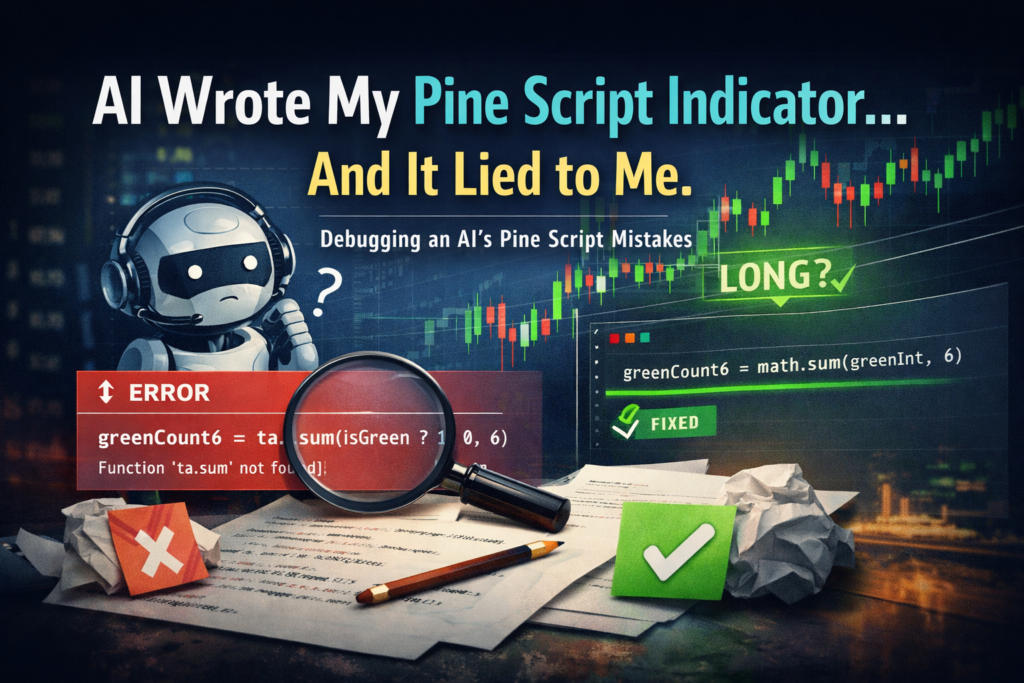
I wanted to build a tiny Pine Script indicator. Nothing fancy. No machine learning. No complex strategy logic. Just this: “Show a long signal when there are at least 5 green candles in the last 6 bars.” So I asked ChatGPT to write it. And it immediately produced something that looked correct… but wasn’t.The prompt Write me AI Wrote My Pine Script Indicator… and It Lied to Me Read More →
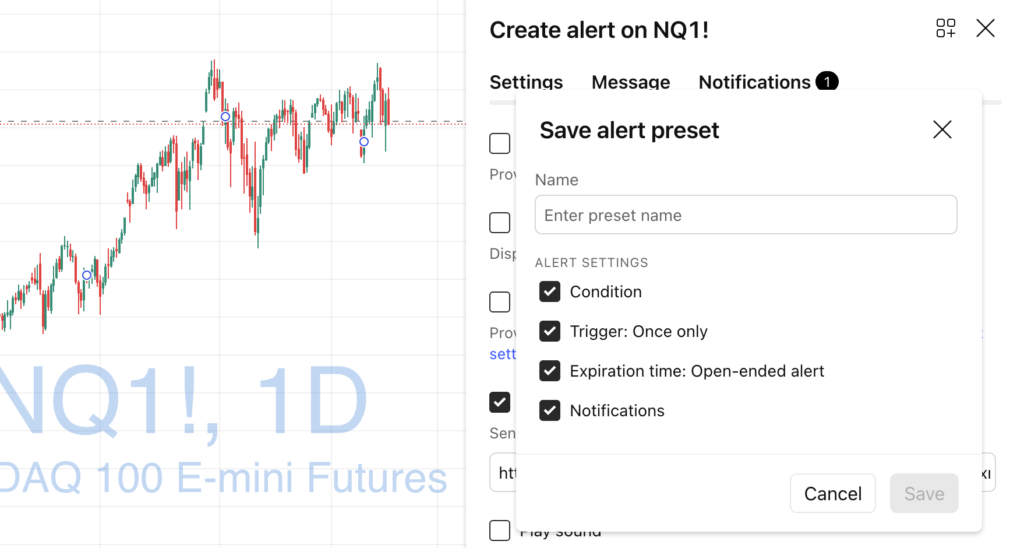
If you actively trade or monitor markets in TradingView, you probably create a lot of alerts.Price levels, indicator conditions, strategy alerts, webhook alerts… it adds up quickly. But did you know that TradingView Alert Presets allow you to reuse alert settings and create new alerts in seconds? In this article, you’ll learn: What Alert Presets Save Time with Alert Presets in TradingView Read More →
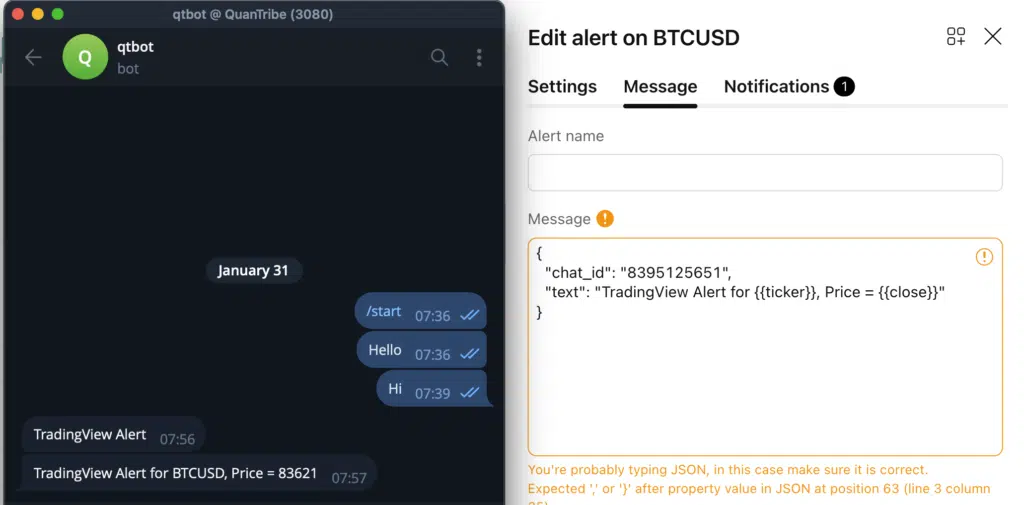
If you use TradingView alerts and want to receive them instantly on Telegram, you might think you need Zapier, paid bots, or third-party services.Good news: you don’t. TradingView can send alerts directly to Telegram using native webhooks, completely free, with no intermediaries. In this tutorial, you’ll learn how to connect TradingView alerts to a Telegram How to Connect TradingView Alerts to Telegram Bots (100% Free) Read More →