R

Simplifying Grid Optimization in R for Backtesting: A Minimal Code Approach

R

Simplifying Grid Optimization in R for Backtesting: A Minimal Code Approach

In quantitative trading, optimizing your backtest can be a time-consuming task. However, with R’s powerful capabilities, you can streamline this process using just a few lines of code. In this article, I’ll walk you through a simple, efficient approach to implementing grid optimization for backtesting in R. Whether you’re a seasoned trader or new to Simplifying Grid Optimization in R for Backtesting: A Minimal Code Approach Read More →

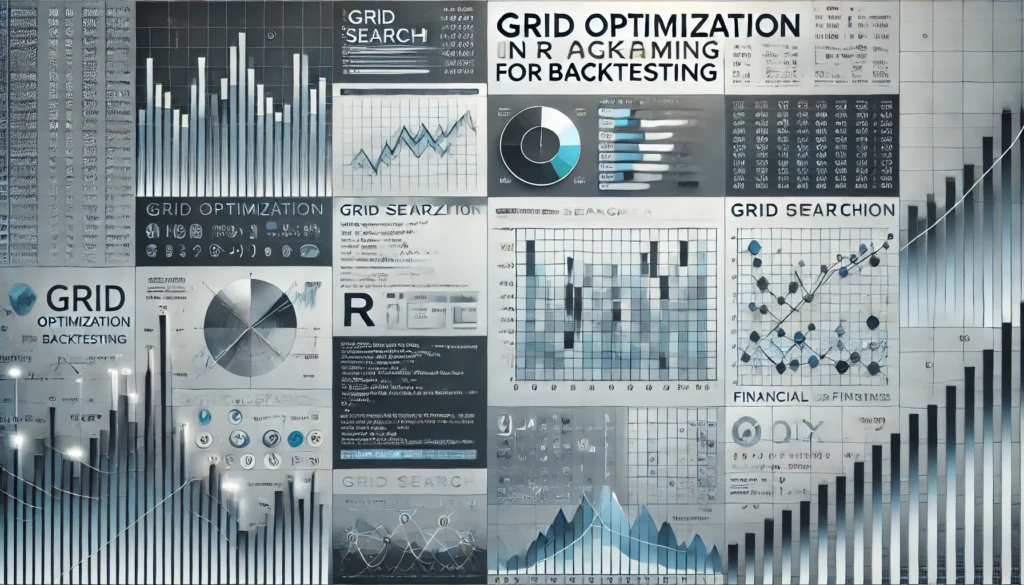
Build a Backtesting Dashboard in R Shiny in Just 10 Minutes! [Video Tutorial + Code]

Introduction: Creating a web dashboard might seem complex, especially if you lack web development experience. But with R Shiny, you can build a powerful, interactive dashboard in just minutes—no coding skills required! In this tutorial, I’ll walk you through the steps to create a backtesting dashboard in R Shiny in only 10 minutes. Check out Build a Backtesting Dashboard in R Shiny in Just 10 Minutes! [Video Tutorial + Code] Read More →

How Accurate are Barchart Trading Recommendations? “Chart of The Day” Analysis.

Here you can find the code for my analysis. These days you see a lot of experts on TV, YouTube, Blogs, and Social Networks sharing their insight into the stock market. They tell us what is going on, they very decisively advice us to buy or sell certain stocks. I always was curious, do they How Accurate are Barchart Trading Recommendations? “Chart of The Day” Analysis. Read More →