Here you can find the code for my analysis.
These days you see a lot of experts on TV, YouTube, Blogs, and Social Networks sharing their insight into the stock market. They tell us what is going on, they very decisively advice us to buy or sell certain stocks.
I always was curious, do they even understand what they were talking about? Their predictions can become wrong, and next week they again appear on TV with the opposite view and try to convince you to do the opposite stuff on the market.
It’s interesting for me to analyze some of these experts and to find out what part of their recommendations makes sense and, most importantly, makes money.
I decided to start with a company called Barchart. It’s data providing company, and it’s not bad. I worked with it on my previous project and continue to receive some newsletters from them.
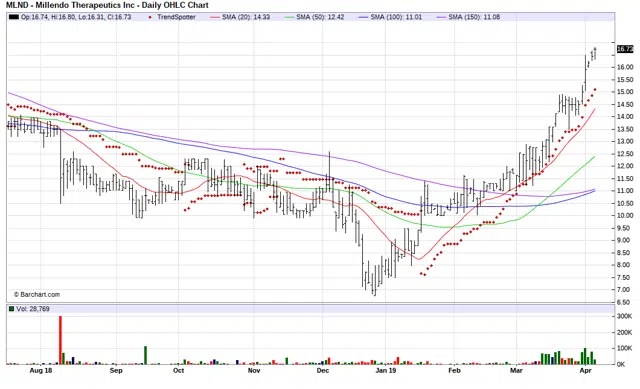
Every day they send me a letter, “Chart of the day”. It looks like this.
Every article has a plot, for example:
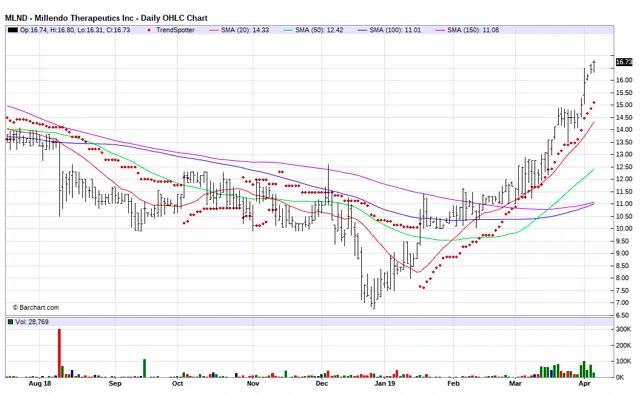
Usually, it looks like a straight line to the top, already gaining 100% in the last few months. They mention that these stocks have 90-100% long indicators and you should probably buy it because of that.
After a few of these kinds of emails, I became a bit skeptical. Graphs look too good to be true, I believe after these good runs, stocks can turn into correction quite quickly. For example, the MLND I showed the plot for lost 50% of its value in the last three months.
So I decided to validate their predictions and find out how good are their technical indicators.
It’s pretty easy to check something like this. I just collected information for all of these articles for 2019, it seems they just started publishing this article only this year. I got 147 results and gathered simple data, like symbol, entry_date – published date, symbol_name – full company name, and signal_perc – % of indicators which are long.
| entry_date | symbol | symbol_name | signal_perc |
|---|---|---|---|
| 2019-08-04 | LSCC | Lattice Semicond | 100 |
| 2019-08-02 | ODT | Odonate Therapeutics Inc | 100 |
| 2019-08-01 | ZIOP | Ziopharm Oncology IN | 100 |
If we’ll summarize % their technical indicator is long, we can get pretty impressive numbers; in 90% of these cases they have 96-100% of indicators agree it’s a long signal.
| signal_perc | % in data |
|---|---|
| 72% technical buy signals | 1.59% |
| 80% technical buy signals | 5.56% |
| 88% technical buy signals | 5.56% |
| 96% technical buy signals | 38.10% |
| 100% technical buy signals | 49.21% |
Not let’s go further and analyze all future performance for these stocks. To do that, I need to collect data from the day they published this article up to today. For simplicity, I will get all data for the entire of 2019. To get the data, I used IEX data API. It’s a pretty nice and available data source you should definitely check. If you want to reproduce my results – you have to register an account in IEX and get a token.
Also, I will get SPY ETF prices for 2019 just to check how these stocks performed vs. the market. SPY is designed to track the S&P 500 stock market index.
| date | spy |
|---|---|
| 2019-01-10 | 258.88 |
| 2019-01-11 | 258.98 |
| 2019-01-14 | 257.40 |
| 2019-01-15 | 260.35 |
| 2019-01-16 | 260.98 |
Now I have data all data I need, let’s check how much these potential long trades did from the publishing date to today.
Summary of stock returns:
  Min.    1st Qu.  Median  Mean   3rd Qu. Max.
 -87.581  -9.177   3.280   2.600  11.548  146.326
SPY performance for the same period:
SPY Perf: 12.65
Stock returns histogram:

Stock returns don’t look very impressive. Mean PnL is 2.6%. There is a stock that lost 87.5% of its value from the beginning of the year, and 25% of stocks lost 9.1% or more (1st Quantile).
If we’re looking at SPY’s performance during this year, it was pretty good, and SPY grew 12.6%. So the majority of these stocks underperformed SPY. So just investing in the market seems like a much better idea.
But let’s go deeper and try to investigate what is going on with these stocks daily. Maybe there was a period when they performed better.
For that, I will normalize my stocks as if it was valued 100$ at the time of trade entry. I will also calculate the average price and normalized S&P price for every date to compare.
Here is a plot with returns per date:
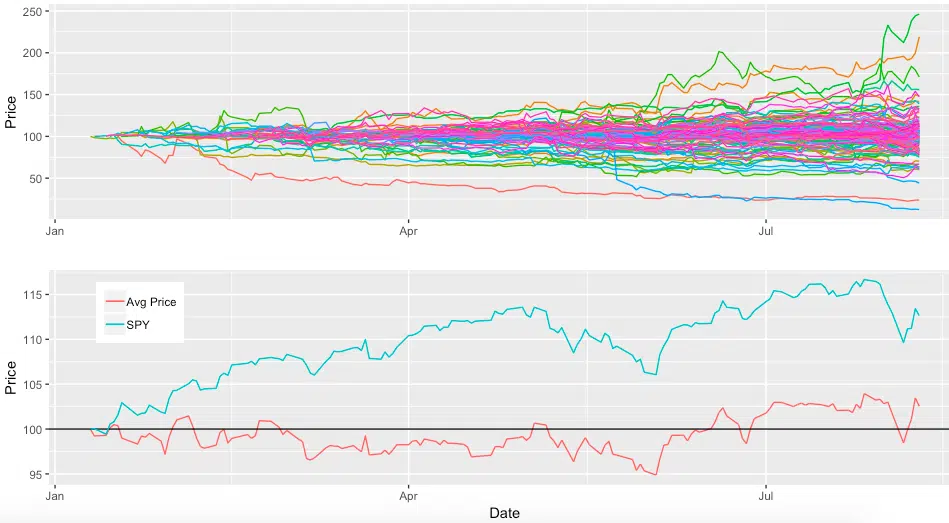
In this plot, we see our 2 “heroes,” who lost ~ 80% of their value during this year.
Looking at the average price, we can see that compared to SPY’s performance, it’s pretty bad.
Not let’s look at these stocks’ performance by the number of days from the entry date.
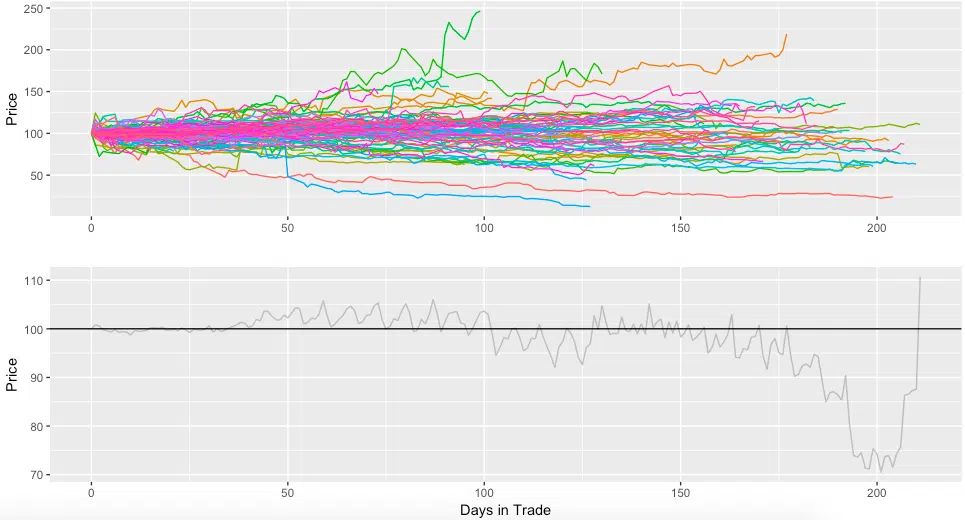
There is a period from 50 to 100 days where these trades, in general, were positive by a few percent, but I don’t think it’s significant to trade these stocks.
In conclusion, I should ask you to be more skeptical about “experts” who are trying to give you 100% robust advice. About Barchart’s “Chart of the Day,” it’s not worth it to trade these stocks based on the rough analysis I did. Mostly I think they use these charts as a marketing tool. They look fantastic, and people just like these kinds of stuff. Yes, they gained X% recently, but you don’t have a time machine, and it’s probably already too late to buy them.
Thank You for going through my article. I hope it helped you. Contact me if you have any questions.
Follow me on TradingView and YouTube.


Great article – I was curious if you thought their general buy sell and hold signals carried much merit – in terms of accuracy?
This is very helpful analysis
Thanks
Hey, didn’t have time to look at their general signals, will take a look when will have some time.
Great article – I was curious if you thought their general buy sell and hold signals carried much merit – in terms of accuracy?
This is very helpful analysis
Thanks
Hey, didn’t have time to look at their general signals, will take a look when will have some time.
Did you take the time to see if they were profitable when the sell recommendation showed up….after all they are trading signals, not investing signals. They are not meant to be bought and held.
Did you take the time to see if they were profitable when the sell recommendation showed up….after all they are trading signals, not investing signals. They are not meant to be bought and held.
Nice 👍 thanks for taking the time .
Enjoyed the article.
Best regards,
Clint
Nice 👍 thanks for taking the time .
Enjoyed the article.
Best regards,
Clint
I took the membership, but I cancelled it after a month, because I found that their probability values in option strategy screening quite inaccurate. Don’t rely on their estimation. Their premium membership is not worth it.
I took the membership, but I cancelled it after a month, because I found that their probability values in option strategy screening quite inaccurate. Don’t rely on their estimation. Their premium membership is not worth it.
I agree with you that Barchart ratings should not be taken as the sole decision to buy a stock. However the best performing stock I found at Barchart and I give them thumbs up.
I agree with you that Barchart ratings should not be taken as the sole decision to buy a stock. However the best performing stock I found at Barchart and I give them thumbs up.