When your TradingView indicator starts growing, the Settings panel can quickly become messy. Too many inputs, unclear sections, and no visual structure make your script harder to use — even if the logic itself is solid.
Fortunately, Pine Script provides a simple way to group inputs into sections, making your indicators cleaner, more professional, and more user-friendly.
In this article, we’ll look at:
- What input groups are
- How to create them
- A practical Pine Script v6 example
- Best practices for organizing indicator settings
What Are Input Groups in Pine Script?
An input group allows you to visually organize related inputs together inside the indicator’s settings window.
Instead of a long, flat list of inputs, users will see sections such as:
- Trend Settings
- Risk Management
- Visual Settings
This is done using the group parameter available in all input.*() functions.
Basic Syntax for Grouping Inputs
The key idea is simple:
inputs with the same group name appear together.
input.int(20, title="Length", group="Moving Average")
input.color(color.blue, title="Color", group="Moving Average")
The string passed to group defines the section name shown in the UI.
Complete Pine Script v6 Example: Grouped Inputs
Below is a simple indicator that plots a moving average and demonstrates clean input grouping.
// This Pine Script® code is subject to the terms of the Mozilla Public License 2.0 at https://mozilla.org/MPL/2.0/
// © QuantNomad

//@version=6
indicator("Grouped Inputs Example", overlay=true)

// ───── Moving Average Settings ─────
ma_length = input.int(
     defval = 20,
     title  = "MA Length",
     minval = 1,
     group  = "Moving Average Settings"
)

ma_source = input.source(
     defval = close,
     title  = "Source",
     group  = "Moving Average Settings"
)

// ───── Style Settings ─────
ma_color = input.color(
     defval = color.blue,
     title  = "Line Color",
     group  = "Style Settings"
)

ma_width = input.int(
     defval = 2,
     title  = "Line Width",
     minval = 1,
     maxval = 5,
     group  = "Style Settings"
)

// ───── Calculation ─────
ma = ta.sma(ma_source, ma_length)

// ───── Plot ─────
plot(ma, color=ma_color, linewidth=ma_width)
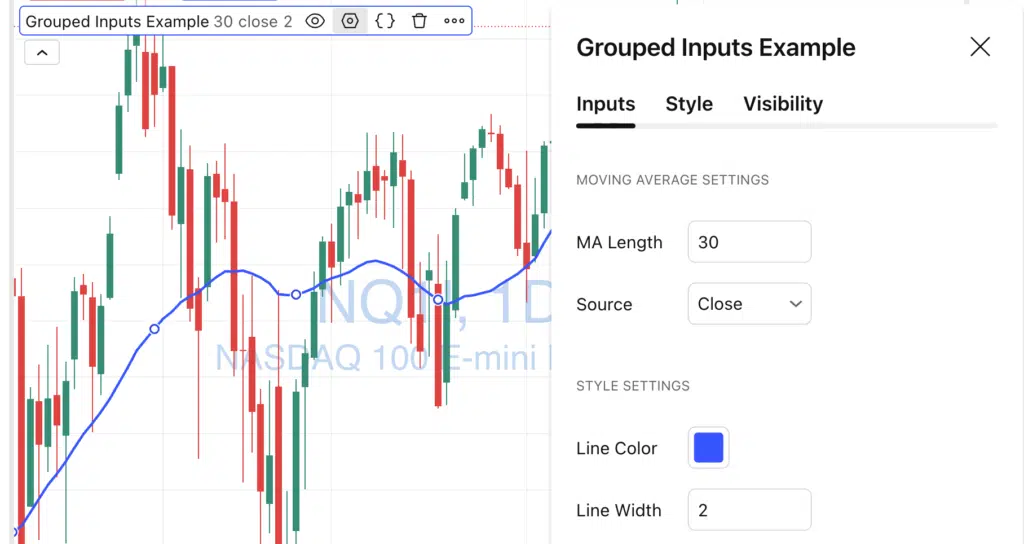
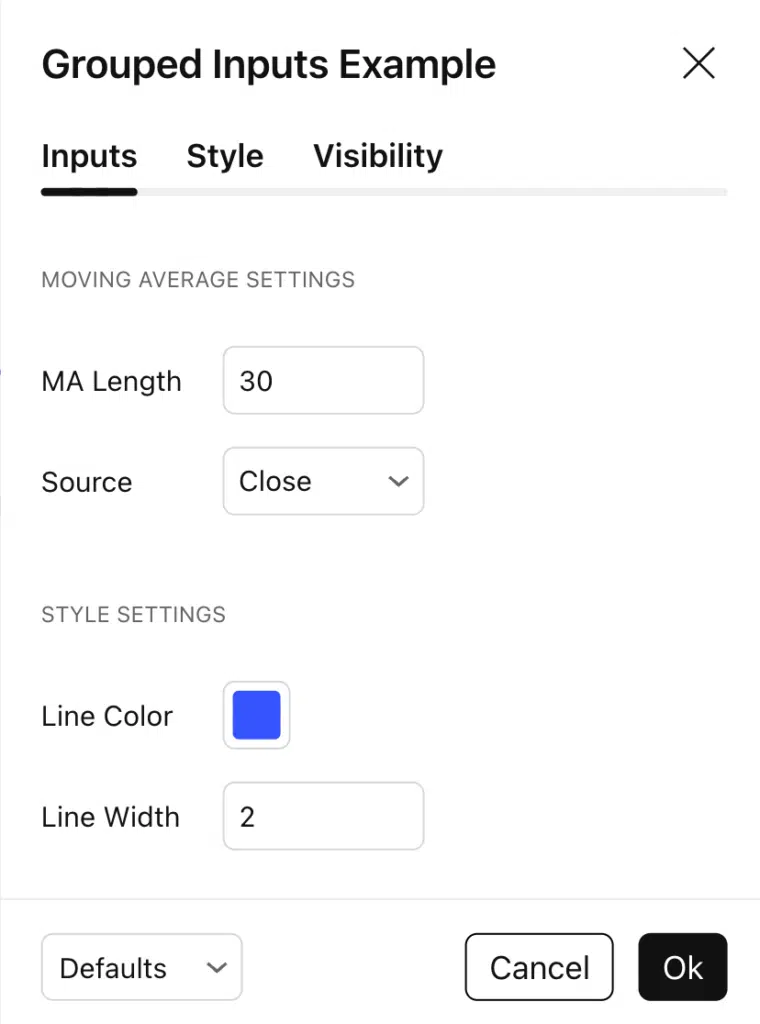
What This Looks Like in TradingView
In the indicator settings, users will see:
Best Practices for Grouping Inputs
1. Use Clear, Human-Friendly Names
Good:
"Trend Settings""Risk Management""Visual Settings"
Avoid:
"Group1""Misc"
2. Group by Purpose, Not by Type
Don’t group all numbers or colors together.
Instead:
- Logic inputs together
- Visual inputs together
- Advanced settings in a separate group
3. Combine Groups with Conditional Inputs
Grouping works extremely well with:
- Checkboxes
- Inline parameters
- Disabled inputs (
active = condition) - Simple / Advanced mode designs
This allows you to create professional-grade indicator settings.
Common Mistakes
❌ Forgetting to assign group consistently
→ Inputs end up scattered across sections.
❌ Over-grouping
→ Too many groups can be just as confusing as none.
❌ Mixing logic and visual settings
→ Harder for users to understand what matters.
When Should You Use Input Groups?
Use input groups when:
- Your indicator has more than 5–6 inputs
- You plan to publish scripts publicly
- You want to reduce user confusion
- You aim for a professional TradingView UX
Final Thoughts
Input grouping is a small Pine Script feature with a huge usability impact.
It improves clarity, reduces mistakes, and instantly makes your indicators feel more polished.
If you’re building indicators or strategies for other users — group your inputs. Your future self (and your users) will thank you.
Follow me on TradingView and YouTube.