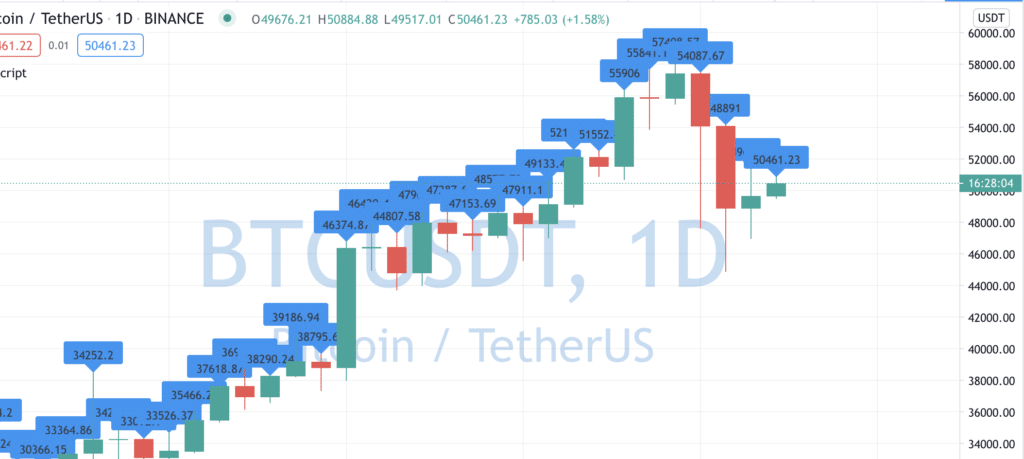
TradingView for some time already introduced lines and label objects in PineScript. It’s a really nice tool and allows you to make pretty nice indicators. The issue is that it’s not so easy to work with them as with usual plot functions. If you’ll just use this simple code:
//@version=4
study("My Script", overlay = true)

label.new(bar_index, high, tostring(close))
It will plot label for every bar, and very often that‘s not what are you trying to achieve:

In this article, I will show you how you can show labels/lines only for the last bar of your chart.
There are 2 solutions for that. In first you can you barstate.islast variable:
if (barstate.islast)
    label.new(bar_index, high, tostring(close))
This works to some extend when you’ll add it to the chart you’ll see only one label as you expect it. But few new live bars appearing on your chart you’ll see that old labels won’t be removed.

A better solution will be to explicitly delete the previous label like that:
l = label.new(bar_index, high, tostring(close))
label.delete(l[1])
This will do the trick for you and you’ll always see only the last label:

For the lines solutions looks very similar:
l = line.new(bar_index, high, bar_index[10], high, width = 2)
line.delete(l[1])
Using this code you’ll always see line only plotted for the last bar:

Follow me on TradingView and YouTube.


