Pine Script is an excellent tool for creating data visualizations. It has a wide range of plotting tools that allow users to graph data in a variety of ways. With these tools, users can customize the look of the graph to their liking, as well as make adjustments to the data to get the most out of their visualizations.
In this article, I’ll cover a straightforward but pretty important feature of plotting in pine script – horizontal lines. The easiest way to plot a horizontal line for the entire width of your chart is to use the plot() function. Just pass to it the value you need, and you’ll get a horizontal line:
plot(1)

If you need a bit more advanced functionality, you have to check the line.new() function. It allows you to plot segments, rays, and lines extending in both directions. First, let’s see how to plot a horizontal segment without extension:
if barstate.islast
    line.new(bar_index[10], close, bar_index, close, width = 2)
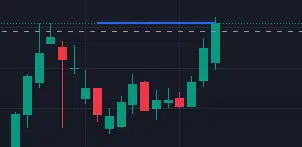
The code above will plot a horizontal line from the close of the last table for the previous 10 bars. To make this line horizontal you need to set 2nd and 4th with the same value for the price. This can be a pretty good solution if you want to show support and resistance levels in your indicator.

Line.new function is quite powerful, and you can do quite exciting plots with it. For example, adding “extend” parameter to line.new function, you can quickly transform them into rays:
if barstate.islast
    line.new(bar_index[10], close, bar_index, close, width = 2, color = color.blue,  extend = extend.right)
    line.new(bar_index[10], open, bar_index,   open, width = 2, color = color.green, extend = extend.left)

Follow me on TradingView and YouTube.


