In quantitative trading, optimizing your backtest can be a time-consuming task. However, with R’s powerful capabilities, you can streamline this process using just a few lines of code. In this article, I’ll walk you through a simple, efficient approach to implementing grid optimization for backtesting in R. Whether you’re a seasoned trader or new to backtesting, this guide will help you enhance your strategies without the complexity.
Here is the video where I write that code: https://www.youtube.com/watch?v=o_soTfhN3Qk
First let’s start with preparing the data for it. I want this optimisation to run efficiently so I’ll preload data from EODHD and same it on the disk in CSV files. Later in the code for optimisation I’ll simply read the data from the local drive and won’t query the API every time.
library(jsonlite)
library(tidyverse)

.token <- Sys.getenv('EOD_token')

for (s in c('AAPL.US', 'TSLA.US', 'MSFT.US', 'NVDA.US', 'META.US')){
  df <- fromJSON(str_c('https://eodhd.com/api/eod/',s,'?api_token=' ,.token, '&fmt=json'))
  write_csv(df, str_c("data/", s, ".csv"))
}
Next let’s define our backtesting function. For this example I’ll use very simple simple moving strategy function. When price above SMA I want to be long, when below – flat. This function outputs just a few main backtesting metrics like Annualised return, Sharpe and Standard Deviation.
library(tidyverse)
library(TTR)
library(PerformanceAnalytics)

calculate_simple_strategy <- function(df, params = list(fast_ma = 10, slow_ma = 200)){

  df <- df %>%
    mutate(
      date = as.Date(date)
    ) %>%
    arrange(date) %>%
    mutate(
      pnl = replace_na(adjusted_close / lag(adjusted_close) - 1, 0)
    ) %>%
    filter(date >= '2000-01-01')

  str <- df %>%
    arrange(date) %>%
    mutate(
      fast_ma = SMA(adjusted_close, params$fast_ma),
      slow_ma = SMA(adjusted_close, params$slow_ma),
      pos     = if_else(fast_ma > slow_ma, 1, 0) %>% lag() %>% replace_na(0),
      str_pnl = pos * pnl
    )

  daily_xts <- xts(str$str_pnl, order.by = str$date)

  tbl <- table.AnnualizedReturns(daily_xts)

  names(tbl) <- 'value'
  tbl <- rownames_to_column(tbl, 'metric') %>%
    spread(metric, 'value')

  tbl
}
Now let’s switch to the code for the grid optimisation itself, first we need to source our strategy function and define the grid of parameters we want to run our backtest for:
source("simple_backtest.R")

grid <- crossing(
  symbol = c('AAPL.US', 'TSLA.US', 'MSFT.US', 'NVDA.US', 'META.US'),
  fast_ma = c(1, 3, 5, 7, 10, 12, 15, 20, 25, 30, 40, 50),
  slow_ma = c(10, 15, 20, 25, 30, 40, 50, 75, 100, 150, 200, 250)
)

grid <- grid %>%
  filter(fast_ma < slow_ma)
To run optimisation you can use lapply function for every row of the grid:
grid_res <- lapply(
  1:nrow(grid),
  function(i){

    print(i)

    params <- as.list(grid[i, ])

    df <- read_csv(str_c('data/', params$symbol, ".csv"))

    metrics <- calculate_simple_strategy(df, params)

    metrics <- bind_cols(grid[i, ], metrics)

    metrics
  }
)

grid_res <- bind_rows(grid_res)
That’s it’s, the code for optimisation is ready. Now you can run it. Here are how results look like:

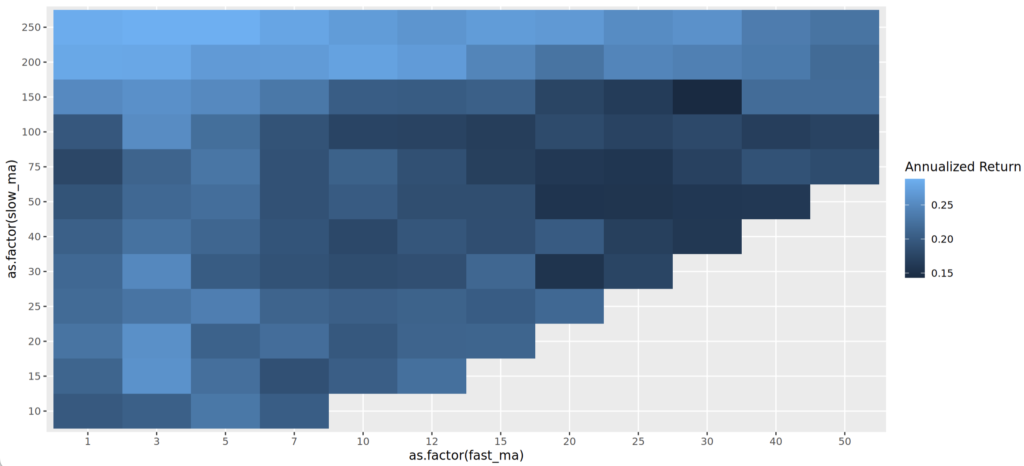
One of the nice way to analyse results can be a heat-map, here is one of the ways to plot it in R:
ggplot(grid_res %>% filter(symbol == 'AAPL.US'), aes(as.factor(fast_ma), as.factor(slow_ma), fill = `Annualized Return`)) +
  geom_tile()

By leveraging R’s flexibility and grid optimization capabilities, you can significantly improve the efficiency of your backtesting process. This minimal code approach makes it easier to test various parameter combinations and find the most effective strategies. With just a few lines of R code, you can take your trading algorithms to the next level, allowing for quicker iterations and better results.


