You may sometimes need to display an indicator on top of the price chart (for instance, when you want to compare patterns in the indicator with the price). Issues may however occur with the price chart if the scale of your indicator is vastly different from the price scale. TradingView will try to display both price and the indicator at the same time (which could mess things up).
Overlay Indicator on Price Chart Pine Script Issues
To demonstrate the issue you may face, let’s try to display a simple RSI on top of the chart using the following code.
//@version=5
indicator("RSI", overlay = true)

rsi = ta.rsi(close, 14)
plot(rsi)
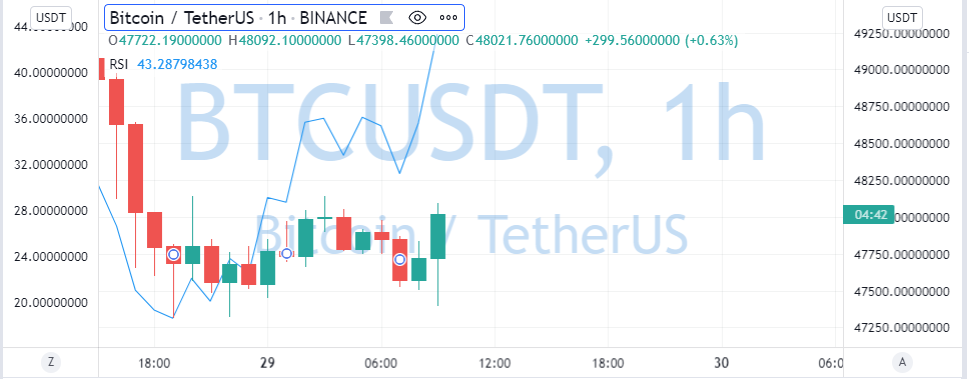
Let me go right ahead and apply it to the BTCUSDT chart. This is what I get.

It results in a mess – you can hardly see either the price or the RSI indicator.
Solution: Use Scale Parameter
So, how do we fix this issue in order to overlay the indicator on the price chart and get a decent outcome? A good way to go about it is by using the scale parameter of the indicator function.
It can take 3 values:
- scale.right – default value. The indicator will have the same scale as the price.
- scale.left – a new scale will be created for the indicator on the left of the chart.
- scale.none – a new scale will be created but it won’t be displayed next to the chart.
In our code example above, scale.left and scale.none should do the trick. Here is the same indicator with the scale.left option:
//@version=5
indicator("RSI", overlay = true, scale = scale.left)

rsi = ta.rsi(close, 14)
plot(rsi)
Thanks to this pretty simple fix, we can now see the indicator nicely plotted on top of the price with a separate scale of the left of the chart:
If it’s not important to you to know the value you can use scale.none value:
//@version=5
indicator("RSI", overlay = true, scale = scale.none)

rsi = ta.rsi(close, 14)
plot(rsi)
This way you’ll see just an indicator to be plotted on top without a separate scale on the left:

Follow me on TradingView and YouTube.