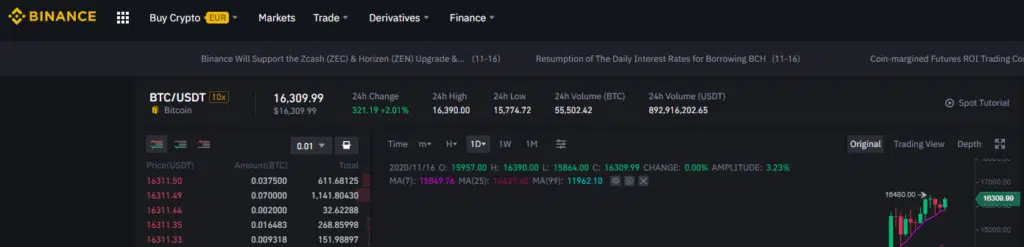
Binance is of the popular crypto exchanges on the market and a lot of people trade on it. It’s important to use historical data to backtest trading strategies. So I decided to create a video showing you how you can download historical bars from Binance. I did it using basic Python modules, so you can use similar approach to get data from other APIs as well.
Libraries used:
import requests                    # for "get" request to API
import json                        # parse json into a list
import pandas as pd                # working with data frames
import datetime as dt              # working with dates
import matplotlib.pyplot as plt    # plot data
import qgrid                       # display dataframe in notebooks
Function to get bars from Binance:
def get_binance_bars(symbol, interval, startTime, endTime):

    url = "https://api.binance.com/api/v3/klines"

    startTime = str(int(startTime.timestamp() * 1000))
    endTime = str(int(endTime.timestamp() * 1000))
    limit = '1000'

    req_params = {"symbol" : symbol, 'interval' : interval, 'startTime' : startTime, 'endTime' : endTime, 'limit' : limit}

    df = pd.DataFrame(json.loads(requests.get(url, params = req_params).text))

    if (len(df.index) == 0):
        return None

    df = df.iloc[:, 0:6]
    df.columns = ['datetime', 'open', 'high', 'low', 'close', 'volume']

    df.open      = df.open.astype("float")
    df.high      = df.high.astype("float")
    df.low       = df.low.astype("float")
    df.close     = df.close.astype("float")
    df.volume    = df.volume.astype("float")

    df['adj_close'] = df['close']

    df.index = [dt.datetime.fromtimestamp(x / 1000.0) for x in df.datetime]

    return df
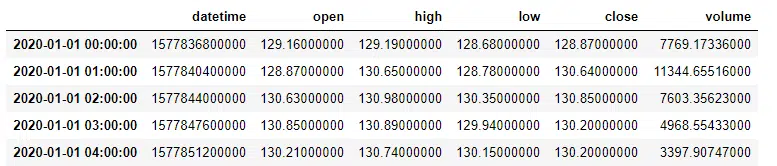
Example of how you can call this function:
get_binance_bars('ETHUSDT', '1h', dt.datetime(2020, 1, 1), dt.datetime(2020, 2, 1))
To get data for a long period of time (more than 1k bars) you have to call this function multiple times and concatenate results. Here is an example of how you can get hourly data for the entire 2020:
# Create a list of first day of every month in 2020
months = [dt.datetime(2020, i, 1) for i in range(1, 13)]
months.append(dt.datetime(2021, 1, 1))
# Call the function for every date range
df_list = [get_binance_bars('ETHUSDT', '1h', months[i], months[i+1] - dt.timedelta(0, 1)) for i in range(0, len(months) - 1)]
# Concatenate list of dfs in 1 df
df = pd.concat(df_list)
Here is the code you can use to get data for entire history:
df_list = []
last_datetime = dt.datetime(1970, 1, 1)
while True:
    print(last_datetime)
    new_df = get_binance_bars('ETHUSDT', '1h', last_datetime, dt.datetime.now())
    if new_df is None:
        break
    df_list.append(new_df)
    last_datetime = max(new_df.index) + dt.timedelta(0, 1)

df = pd.concat(df_list)
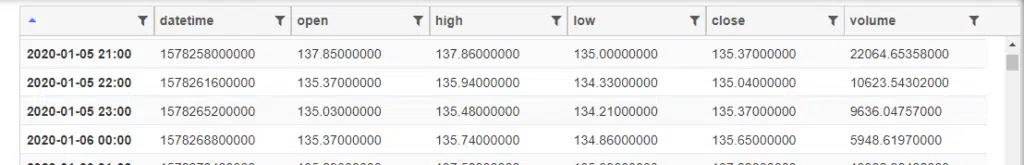
To better display the data frame in the Jupiter notebook, you can use qgrid library. There you can sort by column, use some filters, and review the entire data frame without limits.
qgrid.show_grid(df)
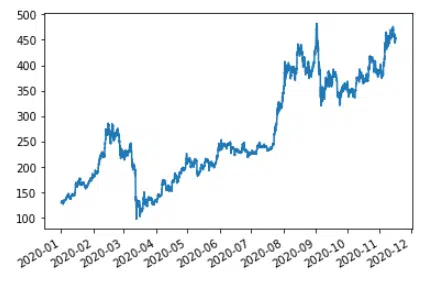
You can plot the data frame using matplotplib library:
df['close'].astype('float').plot()


Hello!
I try to do this in vsc and get this message when I run the part to get all time data:
startTime = str(int(startTime.timestamp() * 1000))
OSError: [Errno 22] Invalid argument
Hello!
I try to do this in vsc and get this message when I run the part to get all time data:
startTime = str(int(startTime.timestamp() * 1000))
OSError: [Errno 22] Invalid argument
Hello,
I run into the same error as JLF
Hello,
I run into the same error as JLF
To solve the error mentioned by JLF, i just put last_dateTime = dt.datetime(2000,1,1) and it worked like a charm
To solve the error mentioned by JLF, i just put last_dateTime = dt.datetime(2000,1,1) and it worked like a charm
If using all scalar values, you must pass an index