Depending on the type of your indicator, you might want to plot it on top of your price or in a separate pane. If your indicator has the same scale as your data, you might want it to display on top, for example, BB, SMA, or Ichimoku cloud. If the scale is completely different, you should better to use a separate chart not to ruin your price bars with a very different scale, as RSI has, for example.
The default behavior of the Pine Script is to plot your indicator in a separate chart. If you’ll apply the following code to you chart:
//@version=5
indicator("My script")
plot(close)
You’ll see that the new chart appears with independent axis, not dependent on your price chart:

To change the default behavior of your indicator, you have to change the overlay parameter of your “indicator()” function call to “true” like this:
//@version=5
indicator("My script", overlay = true)
plot(close)
This will add our indicator on top of the price:
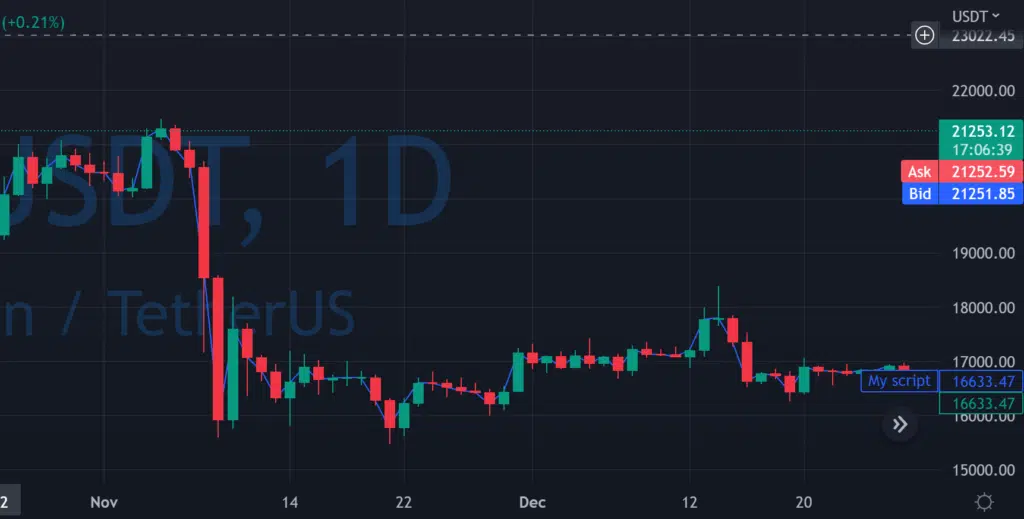
You can change the same parameter for the strategy and ask it to display data on top of the chart.
Unfortunately, at this point is not possible in TradingView to plot anything overlying the price in a separate chart from the same script. If you want to do that, you have to create two separate scripts.
Follow me on TradingView and YouTube.