TradingView provides an incredibly powerful platform for traders to analyze the markets and make informed decisions. One of the most desired features of Pine Script is custom screeners. Custom screeners allow traders to quickly and easily find stocks/coins that meet their criteria.
Quite often, you might want to sort the result of your customs screener. This can help you to spot stocks/coins with the biggest/smallest values of specific indicators pretty easily. In this article, I’ll show you only a few lines of code way to do that.
Let’s start with the following code for a simple screener:
//@version=5
indicator("2 arrays", overlay = true)

rsi1 = request.security('AAPL', timeframe.period, ta.rsi(close, 14))
rsi2 = request.security('DIS',  timeframe.period, ta.rsi(close, 14))
rsi3 = request.security('MSFT', timeframe.period, ta.rsi(close, 14))
rsi4 = request.security('V',    timeframe.period, ta.rsi(close, 14))
rsi5 = request.security('TSLA', timeframe.period, ta.rsi(close, 14))

tsi1 = request.security('AAPL', timeframe.period, ta.tsi(close, 13, 25))
tsi2 = request.security('DIS',  timeframe.period, ta.tsi(close, 13, 25))
tsi3 = request.security('MSFT', timeframe.period, ta.tsi(close, 13, 25))
tsi4 = request.security('V',    timeframe.period, ta.tsi(close, 13, 25))
tsi5 = request.security('TSLA', timeframe.period, ta.tsi(close, 13, 25))

symbols = array.from('AAPL', 'DIS', 'MSFT', 'V', 'TSLA')

rsi_arr = array.from(rsi1, rsi2, rsi3, rsi4, rsi5)
tsi_arr = array.from(tsi1, tsi2, tsi3, tsi4, tsi5)

var tbl = table.new(position.top_right, 3, 6, frame_width  = 1, border_width = 1, border_color = #696969)

if barstate.islast
    table.clear(tbl, 0, 0, 2, 5)

    table.cell(tbl, 0, 0, text = 'Symbol', text_color = color.white, bgcolor = #696969)
    table.cell(tbl, 1, 0, text = 'RSI',    text_color = color.white, bgcolor = #696969)
    table.cell(tbl, 2, 0, text = 'TSI',    text_color = color.white, bgcolor = #696969)

    for i = 0 to array.size(symbols) - 1
        table.cell(tbl, 0, i + 1, text = str.tostring(array.get(symbols, i)), text_color = color.white, bgcolor = #696969)
        table.cell(tbl, 1, i + 1, text = str.tostring(math.round(array.get(rsi_arr, i), 2)), text_color = color.white, bgcolor = #aaaaaa)
        table.cell(tbl, 2, i + 1, text = str.tostring(math.round(array.get(tsi_arr, i), 2)), text_color = color.white, bgcolor = #aaaaaa)
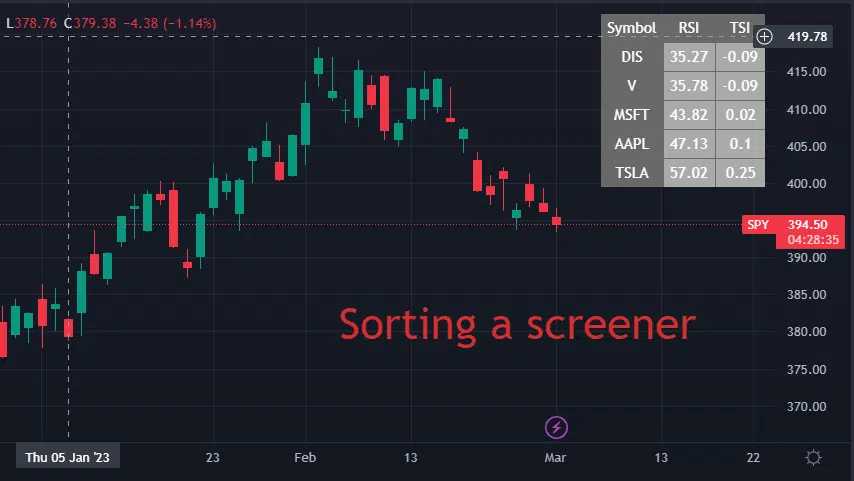
Here is the result we get from this screener:
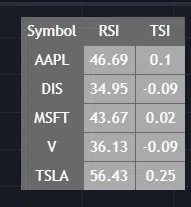
So it’s a pretty simple screener that computes RSI and TSI values for five stocks and displays it on the chart. Of course, your example can be much more complicated. If you take a look at the code, you can see that it’s quite simple there as well. I request RSI and TSI values for all the stocks and then store results and tickers in separate arrays. After that, in a loop, I go through this array and create cells for all the values.
So let’s imagine we want to sort this screener by RSI. Off course, TSI values and symbols should be sorted together with the RSI value. To do that, we can use “array.sort_indices” function following way:
sorted_index = array.sort_indices(rsi_arr)
This will output us indices for the sorted RSI array but won’t sort the array itself. Now we can use these indices instead of the usual iterator to plot a sorted array. We can do that by creating another iterator and use this iterator instead of the previous one:
    for i = 0 to array.size(symbols) - 1
        si = array.get(sorted_index, i)
        table.cell(tbl, 0, i + 1, text = str.tostring(array.get(symbols, si)), text_color = color.white, bgcolor = #696969)
        table.cell(tbl, 1, i + 1, text = str.tostring(math.round(array.get(rsi_arr, si), 2)), text_color = color.white, bgcolor = #aaaaaa)
        table.cell(tbl, 2, i + 1, text = str.tostring(math.round(array.get(tsi_arr, si), 2)), text_color = color.white, bgcolor = #aaaaaa)
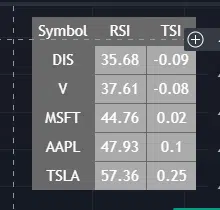
After saving we can see that we have a nicely sorted screener by RSI:
The full code used in this article:
//@version=5
indicator("2 arrays", overlay = true)

rsi1 = request.security('AAPL', timeframe.period, ta.rsi(close, 14))
rsi2 = request.security('DIS',  timeframe.period, ta.rsi(close, 14))
rsi3 = request.security('MSFT', timeframe.period, ta.rsi(close, 14))
rsi4 = request.security('V',    timeframe.period, ta.rsi(close, 14))
rsi5 = request.security('TSLA', timeframe.period, ta.rsi(close, 14))

tsi1 = request.security('AAPL', timeframe.period, ta.tsi(close, 13, 25))
tsi2 = request.security('DIS',  timeframe.period, ta.tsi(close, 13, 25))
tsi3 = request.security('MSFT', timeframe.period, ta.tsi(close, 13, 25))
tsi4 = request.security('V',    timeframe.period, ta.tsi(close, 13, 25))
tsi5 = request.security('TSLA', timeframe.period, ta.tsi(close, 13, 25))

symbols = array.from('AAPL', 'DIS', 'MSFT', 'V', 'TSLA')

rsi_arr = array.from(rsi1, rsi2, rsi3, rsi4, rsi5)
tsi_arr = array.from(tsi1, tsi2, tsi3, tsi4, tsi5)

sorted_index = array.sort_indices(rsi_arr)

var tbl = table.new(position.top_right, 3, 6, frame_width  = 1, border_width = 1, border_color = #696969)

if barstate.islast
    table.clear(tbl, 0, 0, 2, 5)

    table.cell(tbl, 0, 0, text = 'Symbol', text_color = color.white, bgcolor = #696969)
    table.cell(tbl, 1, 0, text = 'RSI',    text_color = color.white, bgcolor = #696969)
    table.cell(tbl, 2, 0, text = 'TSI',    text_color = color.white, bgcolor = #696969)

    for i = 0 to array.size(symbols) - 1
        si = array.get(sorted_index, i)
        table.cell(tbl, 0, i + 1, text = str.tostring(array.get(symbols, si)), text_color = color.white, bgcolor = #696969)
        table.cell(tbl, 1, i + 1, text = str.tostring(math.round(array.get(rsi_arr, si), 2)), text_color = color.white, bgcolor = #aaaaaa)
        table.cell(tbl, 2, i + 1, text = str.tostring(math.round(array.get(tsi_arr, si), 2)), text_color = color.white, bgcolor = #aaaaaa)
Follow me on TradingView and YouTube.