With the latest events on the market USD yield curve has become a very hot topic in all the news. Many traders want to use it in backtest and custom quantitative analysis. In this small article, I’ll show you how to download the entire history of the US Yield curve in Python just in a few lines of code.
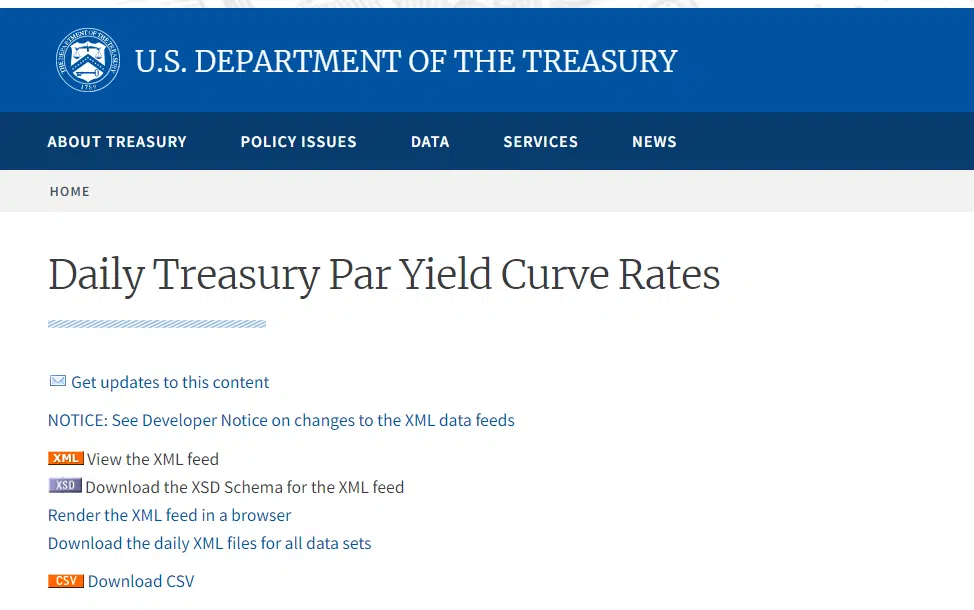
Fortunately, this data is free, and you can easily download it from the U.S. DEPARTMENT OF THE TREASURY website. When you check this website, you’ll see a table with a yield curve for 2023 in a nice table:

In addition to that, you can see a link to download it as CSV and a dropdown to select the year. So our goal is to generate links for all these CSVs, download them and then merge them into one data frame. Let’s start with loading the libraries we need in our code:
import requests                       # for "get" request to API
import pandas as pd                   # working with data frames
from bs4 import BeautifulSoup         # for web scraping and parsing HTML
from fake_useragent import UserAgent  # provides a fake User-Agent header for web scraping
Next, let’s download the page of this website. From it, we’ll be able to get the list of years we have data for and a template of the CSV file URL we’ll use for downloading.
# create an instance of the class UserAgent
user_agent = UserAgent()

headers = {
    "User-Agent": user_agent.random
}

res = requests.get("https://home.treasury.gov/resource-center/data-chart-center/interest-rates/TextView?type=daily_treasury_yield_curve&field_tdr_date_value=2023", headers=headers)

html = BeautifulSoup(res.text, "lxml")
Now let’s get the list of years from the select input you see on the page:
list_of_tag_years = html.find("select", {"data-drupal-selector": "edit-field-tdr-date-value"}).find_all("option")
list_years = [tag.text for tag in list_of_tag_years[1:len(list_of_tag_years) - 1]]

And the URL we’ll use to download data:
link = html.find("div", {"class": "csv-feed views-data-export-feed"}).find("a").get("href")

Now we have everything ready to loop over the list of years and download all CSVs.
df_list = []

for year in list_years:
    print(year)
    response = requests.get(link.replace("2023", year)).text.split("\n")

    list_table = [[*row.split(",")] for row in response[1:]]

    df = pd.DataFrame(list_table, columns=response[0].split(","))
    df.columns = df.columns.str.strip('"')
    df_list.append(df)
This code will request a CSV for every year in the list and save it the result as a list of data frames. The last thing we must do is join all data frames together.
df_all = pd.concat(df_list)
This will output us a pretty nice data frame with the entire history of USD yield curve history:

Follow me on TradingView and YouTube.