I’m happy that market data APIs are becoming increasingly accessible to everyone. This democratizes the market and gives everyone a better chance to make informed investments and trading decisions. With services like EODHD, you can now access US stocks for as little as $20 a month. Eodhistoricaldata.com does not sponsor this post, it’s just an excellent value for money, so I want to share it with you.
In this article, I’ll show you how you can download stock-adjusted daily data from major US exchanges in Python. I’m using a paid 19.99/month account for this code, but you can start exploring it even with a free account.
First, import the needed libraries and set up the API key. You can see your API token from the settings of your account.
import datetime as dt     # working with dates
import pandas as pd       # working with data frames
import requests           # for "get" request to API

eod_api = "YOUR-API-KEY"
Next, let’s get all the supported symbols for US exchanges. Here you can find documentation for this call.
url_get_list_of_tickers = f"https://eodhistoricaldata.com/api/exchange-symbol-list/US?api_token={eod_api}&fmt=json"

# get a DataFrame with symbols on the stock exchange US
df = pd.DataFrame(requests.get(url_get_list_of_tickers).json())

df
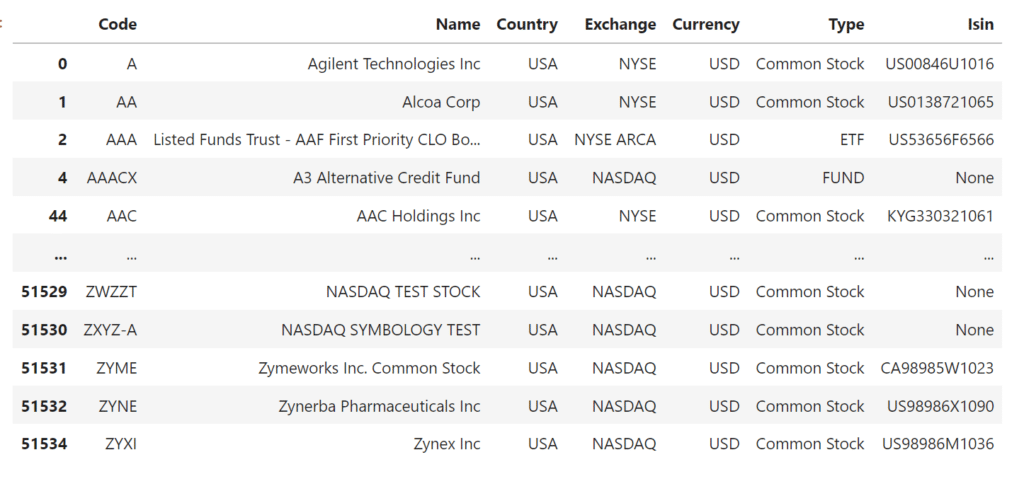
This will output us 51k supported symbols:

To limit this number a bit more, I’ll get symbols only from main US exchanges: “NYSE”, “NASDAQ”, and “NYSE ARCA” :
# make a boolean mask to select specific exchange (NYSE, NASDAQ, NYSE ARCA) in US
df = df[df["Exchange"].isin(["NYSE", "NASDAQ", "NYSE ARCA"])]

# get list symbols(numpy array) from DataFrame
list_symbols = df["Code"].values
Now we have only 11k symbols to download. Let’s now write the code to get EOD historical data for one of the stocks. To get daily data you have to use “eod” endpoint, here you can find documentation for it.
symbol = 'AAPL'

req_params = {
        "api_token": eod_api ,
        "period": "d",
        "fmt": "json",
        "from": "1950-01-01",
        "to": dt.datetime.now()
    }

# send 'get' request with parameters (req_params) and in url substitute (symbol)
df_stock = pd.DataFrame(requests.get(f"https://eodhistoricaldata.com/api/eod/{symbol}.US", params=req_params).json())
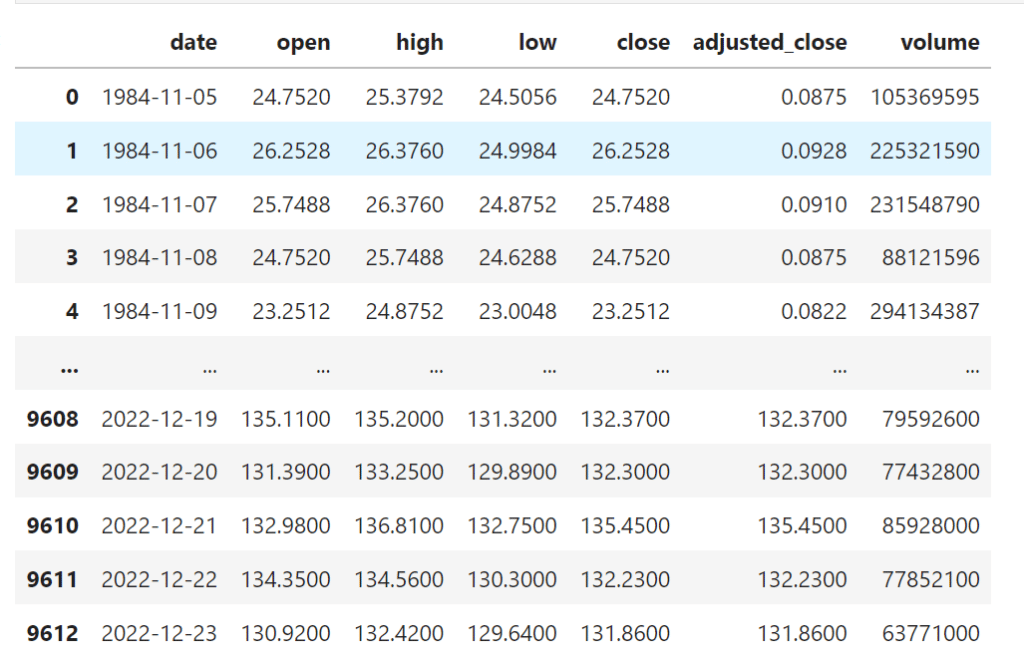
In this chunk of code, we set up needed parameters, such as api_token, period, format, from, and to dates. Next, we call eod API to get the JSON from it and then transform it to a pandas data frame. This will output us a nice data frame with the history of the stock daily bars for the entire history:

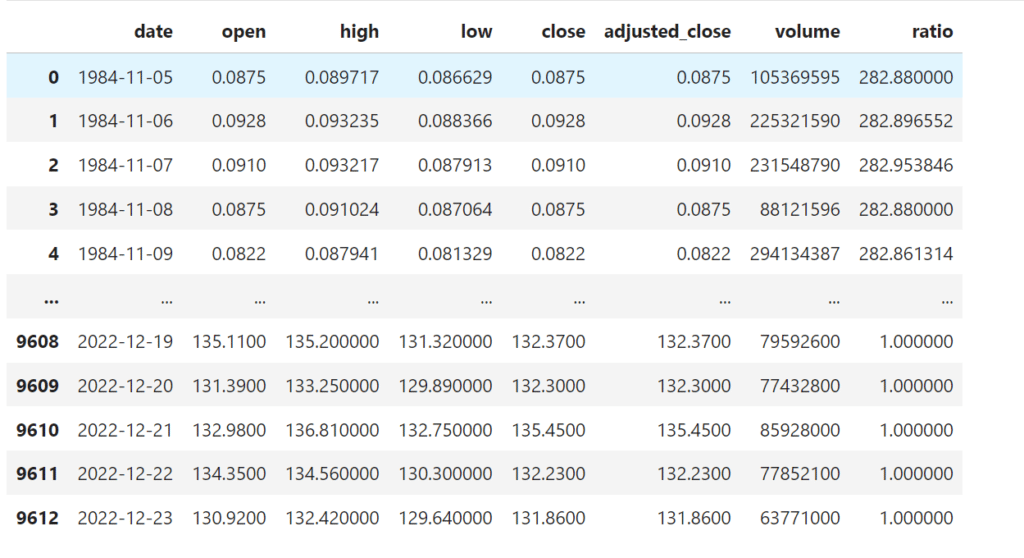
The issue is that OHLC columns are not adjusted, we have a separate adjusted_close column. For backtesting, I need all columns to be adjusted. So I’ll write a small piece of code to adjust all columns. I’ll compute a ratio between close and adjusted close. Then I’ll apply it to all OHLC columns.
df_stock["ratio"] = df_stock["close"] / df_stock["adjusted_close"]

# recalculate adjusted values open, high, low, close
df_stock["open"] = df_stock["open"] / df_stock["ratio"]
df_stock["high"] = df_stock["high"] / df_stock["ratio"]
df_stock["low"] = df_stock["low"] / df_stock["ratio"]
df_stock["close"] = df_stock["close"] / df_stock["ratio"]

df_stock
This will output us adjusted OHLC data we can use for backtesting:

Next, let’s do that in bulk for all the symbols in selected US exchanges. I’ll write a loop that will download all the stock data and save them on the disk as a parquet file. On my server, I have this as a daily scheduled corn process, so I always have updated and ready-for-analysis data. Any paid plan of EODHD has a 100k daily limit of requests, so we should be fine downloading 11k stocks at once.
# in loop through characters from list_symbols
for symbol in list_symbols:
    # create dictionary with request parameters
    req_params = {
        "api_token": eod_api,
        "period": "d",
        "fmt": "json",
        "from": "1950-01-01",
        "to": dt.datetime.now()
    }
    # send 'get' request with parameters (req_params) and in url substitute (symbol)
    df_stock = pd.DataFrame(requests.get(f"https://eodhistoricaldata.com/api/eod/{symbol}.US", params=req_params).json())

    # create new column (ratio) in DataFrame and calculate multiply (close) and (adjusted_close) on every row
    df_stock["ratio"] = df_stock["close"] / df_stock["adjusted_close"]

    # recalculate values open, high, low, close in every row
    df_stock["open"] = df_stock["open"] / df_stock["ratio"]
    df_stock["high"] = df_stock["high"] / df_stock["ratio"]
    df_stock["low"] = df_stock["low"] / df_stock["ratio"]
    df_stock["close"] = df_stock["close"] / df_stock["ratio"]

    # load DataFrame in file parquet
    df_stock.to_parquet(f"/data/{symbol}.parquet")
As you can see, it’s quite a simple example. With an API like EODHD, you can quickly get access to hundreds of thousands of stocks at once, and with just a few python lines of code, you can download them for backtesting.
Follow me on TradingView and YouTube.


